

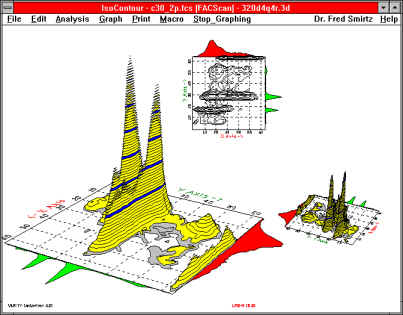
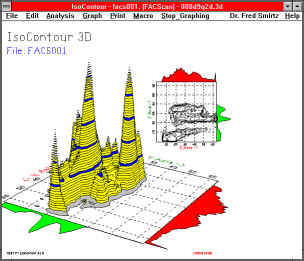
In 1986, we looked around for software which could provide high quality, presentation graphics of 2 parameter flow cytometry data. We couldn't find anything close to what we had in mind. So, we decided to write one. A year later, IsoContour was born. We created it for ourselves, but its full range of features is available to you today in our latest version. With IsoContour, you can rotate images on X, Y, and Z axes so that every little nook and cranny of your data is visible. Change colors, scaling, labels, perspective, and contours to generate the highest quality rendering available. Suppose you need to overlay different views of your data on the same screen. No problem. You want to color one peak red and another blue? Consider it done. What about copying high quality 3D graphics into another Microsoft WindowsTM program? Piece of cake. We didn't quit there, though. IsoContour sports quadstat and region analysis, speedy screen refresh, and macros which help automate your work. It can render images to hundreds of printers from dot matrix to typesetting machines.
• Runs in Microsoft WindowsTM environment.
• Multitasks with other applications.
• Multi-user site licensing available.
• Fully illustrated tutorial and reference manual.
• Histogram and FCS listmode file support.
• Supports FCS, binary and ASCII formats.
• Generate fast hidden-line display with high-speed redraws for superior graphic images.
• Create, modify, and store any number of transformations.
• View transformation changes in real-time with the graphics animator.
• Move, scale, and rotate about all three axes.
• Adjust perspective for 3D effects.
• Edit colors by mixing of red, blue, green and hatch patterns.
• Align axis grid on biologically significant boundaries.
• Add 2D and 3D labels, including axis tic numbers.
• Display keyword values from FCS data files, as well internal keywords.
• Overlay graphics for multiple views of data.
• Create regions for analyzing and coloring contours.
• Save pictures to disk for later review or export.
• Import and export Windows Metafile (picture) format.
• Quadstat and regional statistical analysis and reporting of user-selected results and regions.
• Create macros for exact results replication.
• Supports hundreds printers, plotters, and slide makers.
• Print bitmap, text, and rendered images for highest quality graphics output.
• Copy to the Windows clipboard for exporting graphics and analysis results to other applications.
• Supports the Windows Dynamics Data Exchange (DDE).
• Accepts ASCII or binary data from other Windows programs via DDE.
• On-line help with search and browse.
• Integrates seamlessly with Verity's WinList, our full-featured listmode processor.
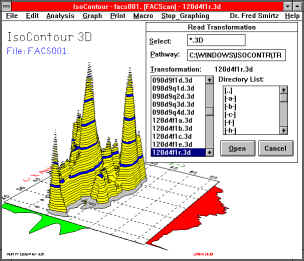
. 1. Select a view from a huge library of choices
 .
.
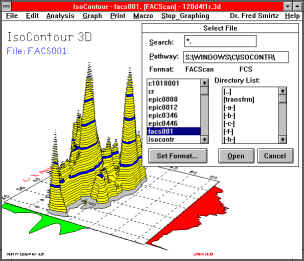
2. Select a data file to graph and analyze.
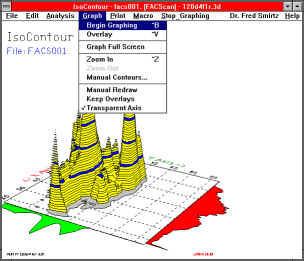
3. Click to draw or overlay the graphics.
4. View and print the detailed images.
![]()
 |
 |
 |
 |